U.S. Yield Curve Analysis
A new analysis predicts that the U.S. Treasury two-year bond yield is set to overcome the U.S. Treasury ten-year bond yield between the beginning of November 2018 and the end of January 2019 - most likely in December 2018.
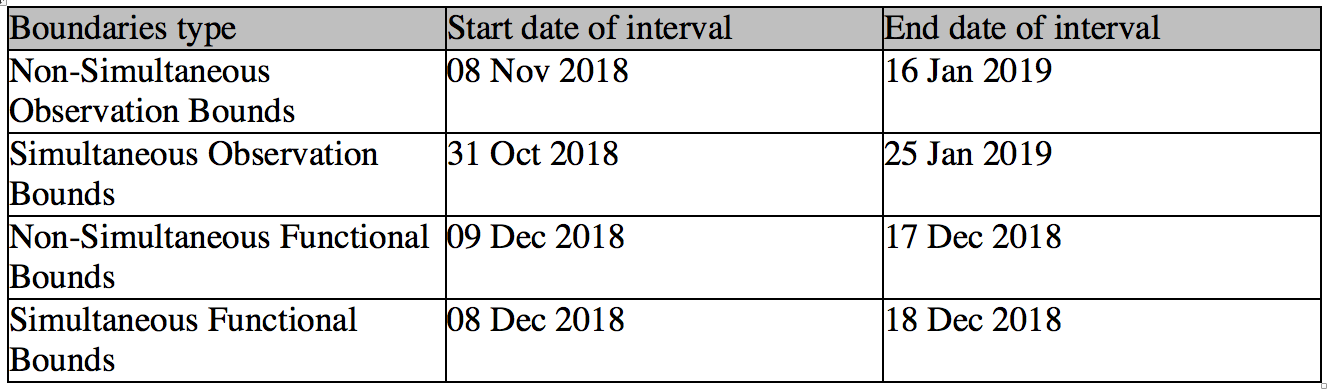
This analysis suggests that, with a 95% confidence interval using simultaneous observation bounds, an inversion of the U.S. yield curve is likely to happen between 31 Oct 2018 and 25 Jan 2019 if the current trend is maintained. The thinnest confidence interval, using non-simultaneous functional bands, predicts an inversion of the yield curve between 09 Dec 2018 and 17 Dec 2018. The x-intercept is set for 13 Dec 2018.
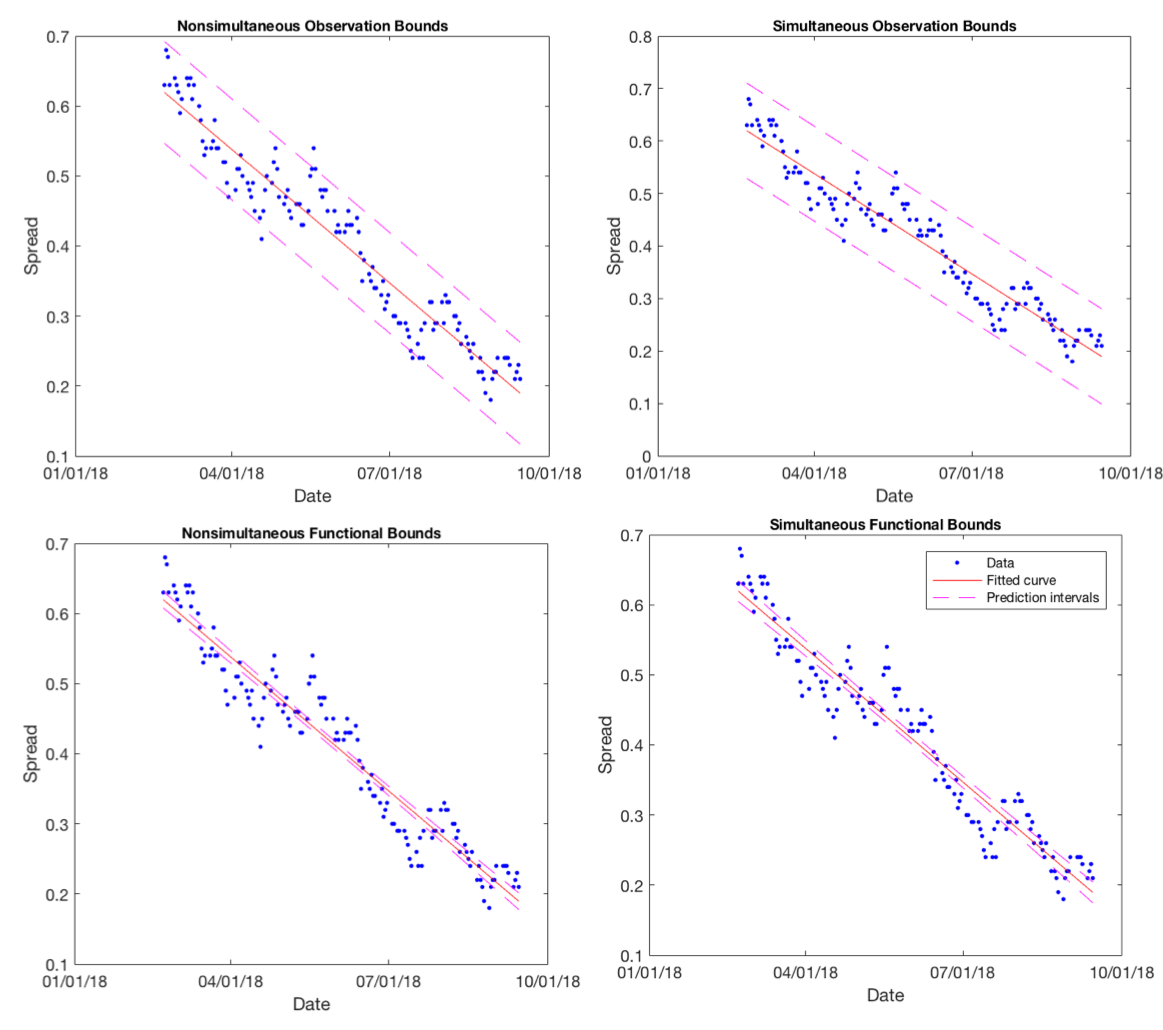
The U.S. yield curve corresponds to the U.S. sovereign bonds’ yields against their respective maturity. A normal yield curve shows that short-term bonds have lower interest returns than long-term bonds, while an inverted yield curve exposes the fact that short-term bonds have higher interest returns than long-term bonds. You can find below the four possible bounds used for this research. The blue dots represent the spread between the U.S. Treasury ten-year and two-year bond yields, data courtesy of the St Louis U.S. Federal Reserve.
The fitting line was found with a correlation coefficient squared of r2=0.9234, this is adjusted to the degrees of freedom generated by the model.
The inversion intervals are given as follows according to the different bounds: Note that these intervals work provided that the trend since February 2018 is holding until inversion.
The data also provides an average rate of change of the spread between the ten-year and two-year yields, given at -0.58% on a daily basis, proving inversion.
Some argue that the quick inversion of the U.S. yield curve is due to the U.S. Treasury’s decision to stop extending the weighted average maturity of its issuance, the anchoring effect of low long-term global rates, and the ability for U.S. corporations to currently deduct pension contributions at the 2017 tax rate of 39% rather than the new 20% tax rate, leading to a rush to buy long-dated bonds. Others believe that it is mainly due to the U.S. government and corporate debts which have reached peak levels of 2007.
The yield curve is a powerful indicator of U.S. recessions, including the subprime mortgage crisis in 2008-2009. Investors are more willing to switch their investment to risk-free assets since short-term bonds offer higher yields when the curve is flat or inverted. There has always been a recession within 17 months following the inversion of the U.S. yield curve - the most significant being the 2008 crisis as it was made late due to the huge insurance bond market (which products include the Collateralised Debt Obligations and Credit Default Swaps) which was 20 times bigger than the underlying bond market.