Rendering shapes through audio signals
Tech Editor Sudarshan Sreeram reports on a passion project of Imperial student James Ball, who has repurposed an old oscilloscope

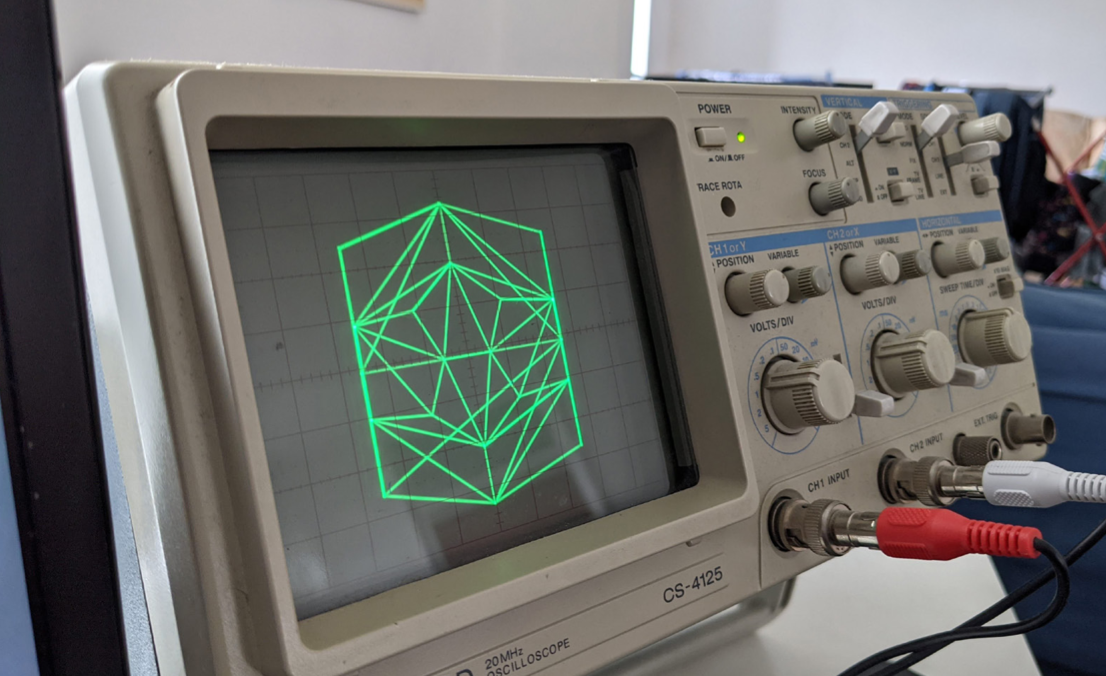
The fast-paced nature of a college lifestyle imposes various time constraints on one’s freedom to explore hobbyist curiosities. With the passion and dedication to overcome those constraints, however, an individual can reap incredible results. One such individual is James Ball, a second-year undergraduate at Imperial’s Department of Computing, who has brought new life into an old oscilloscope (o-scope) by repurposing it to render and visualise shapes through audio signals.
The birth of this quest started nearly a year and a half ago on James’s first day on campus as a freshman when he bought an old, used o-scope from a lab in the EEE department. O-scopes are used traditionally as testing or calibration tools for electronic circuits. Their primary function is to visualise the variation of electrical signals with time, where the horizontal axis depicts the flow of time. James configured the o-scope to use a special two-channel mode, “X-Y Mode”, that visualises the interdependency of two input voltage sources. Here, one voltage influences the displacement of a point along the horizontal axis, while the other along the vertical axis. The rapid, controlled fluctuation of the sources traces shapes on the screen as images.
Analogue o-scopes, like the one James bought, display voltages using a cathode ray tube (CRT), similar to the one found in a bulky, old computer monitor or television. The CRT fires an electron beam that emits light upon striking a plate of phosphorous crystal. Modern, digital o-scopes try to emulate this behaviour and are more convenient for data handling and reproduction but do produce worse-looking images.
Since analogue audio signals are just alternating current (AC) voltages, with the oscillating frequency within the human audible range, the left and right audio channels serve as input sources to the horizontal and vertical axes of the o-scope. James has written a program (osci-render) to generate this audio source algorithmically, with the generated audio played through his computer speakers and visualised through his o-scope.
The rapid, controlled fluctuation of the sources traces shapes on the screen as images
Compound shapes rendered on the o-scope consist of three primitives: lines, cubic Bézier curves, and quadratic Bézier curves. They are traced by iterating through all points that make up their form — imagine dotting along a line where the distance between two consecutive dots is negligible. This method creates an illusion as if the path was traced “without lifting a pen off the page.” Thus, it’s possible to visualise 3D objects, images, and text with additional transformations and effects, such as scaling and rotation.
However, James did face quite the hiccup when he realised that the tracing order of these primitives is crucial for a good-looking output. Since the electron beam is constantly firing at the plate, any sharp jump in the traced position would create a trace artefact that’s slightly visible to the human eye; in short, the more the jumps, the messier the output looks. These jumps also take time, which reduces the rate of drawing.
James found that a potential solution is to sort the individual traces using some graph traversal algorithm. Here, the graph is the compound shape, and the traversal is the drawing path with the minimal number of jumps and trace repeats. The specific algorithm he chose was “Route Inspection”, which aims to find the shortest path that traverses all edges of the graph. Here, jumps are considered edges with a high associated path cost, which dissuades the algorithm from taking them. The result is clean drawings that look much nicer! These drawings won James and his team the “Best Newcomers Hack” award at IC Hack 2020, the largest student-run hackathon in the UK.
James is continually exploring new ways to improve his program through experimenting with additional features. He recently introduced the ability to record audio for audio playback, sharing, or sampling in music. Currently, he’s working on adding a live visualisation of audio frequencies, and he hopes to make a software-emulated, accurate version of an analogue o-scope display as a long term objective.
For one looking to recreate the project, there’s a boatload of specific requirements. It’s quite the lengthy process to obtain an analogue o-scope from the ’70s that supports “X-Y Mode”! These o-scopes are usually available on eBay from anywhere between £40-100, though, there are over fifty years old in some cases, so it’s essential to find one in full-working condition. An additional requirement is a high-quality, “dc-coupled” digital-to-analogue converter (DAC) with a high audio sampling rate; this type of DAC significantly improves the drawing quality, and James uses the “Schiit Modi 3” DAC. Although, a more affordable, DIY option would be to use a “HiFiBerry DAC+”, which uses a Raspberry Pi. For any further questions, feel free to contact James Ball at james@ball.sh.


