What ICU's Leadership Elections tell us about the student union
Every year around this time, student social media is flooded with election chatter. Imperial students are swamped with follow requests from campaign accounts and Instagram stories endorsing one candidate or another.
Beneath the spectacle though, an important process is at work. Imperial College Union’s (ICU) Leadership Elections determine which students run clubs, societies, and projects (CSPs), and the Union itself.
They are the most prominent set of events in ICU’s calendar each year, and over the course of several years, can shape the student experience significantly.
Up for grabs are positions in the Union’s Officer Trustee team (a group of five students who take a year out of their studies to lead ICU as paid employees); roles in the Union’s representation network, which consists of over 600 elected student representatives; and committee positions for ICU’s 400 or so CSPs.
The elections are a test not only of the candidates standing for office, but also ICU itself. Election turnout can be viewed as a bellwether of student engagement with the Union.
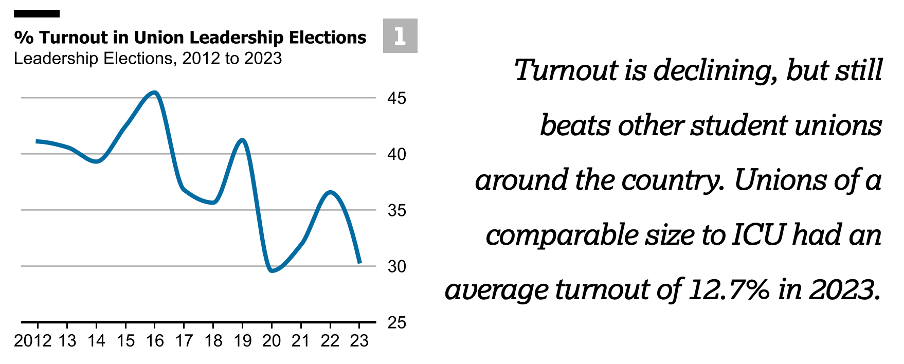
In 2023, the most recent year for which figures are available, 30.4% of eligible students voted (see chart 1). Since 2012, turnout in ICU’s elections has fallen by a quarter, but still remains well above national levels.
Last academic year, the National Union of Students (NUS), a consortium of UK-based student unions excluding ICU, surveyed 76 of its members. It reported that unions with 10,000 to 20,000 students – comparable to ICU – achieved an average turnout of 12.7%.
ICU election figures show that undergraduate students are far more engaged with the Union than postgraduates (see chart 2). Undergraduates are three to four times more likely to vote in the elections than postgrads, despite representing roughly equal proportions of the student population.
This has undoubtedly had its impact on Union politics. Nine of the past ten Union Presidents at ICU were undergraduate students before being elected to the role, and for the most part, made little mention of postgraduates in their manifesto pledges.
Other universities such as UCL have a full-time sabbatical officer dedicated to addressing the needs of postgraduates. At Imperial, a volunteer-run Graduate Student Union (GSU) once existed, but was scrapped in 2022 by the only Union President in the past ten years to have been a postgrad themselves.
‘The difference between UG and PG engagement and satisfaction with the Union, across a wide range of metrics, is stark – and unacceptable,’ wrote then-Union President Lloyd James , supporting calls for a new system from a student-led working group. He said the GSU had ‘a mixed track record’ but had ‘not achieved a significant overall level of impact on the PG experience’.
The GSU was disbanded and its functions subsumed into the central Union, with new postgraduate representative positions created. Under the new system, responsibility for postgraduates ultimately lies with two sabbatical officers, the Deputy President (Education) and Deputy President (Welfare).
Last year’s election turnout figures show that much remains to be done in order to engage postgraduates. Promisingly though, this year’s Deputy President (Education), Yi Yang, says she has made postgraduate engagement one of her priorities, and has met with students and staff to initiate change.
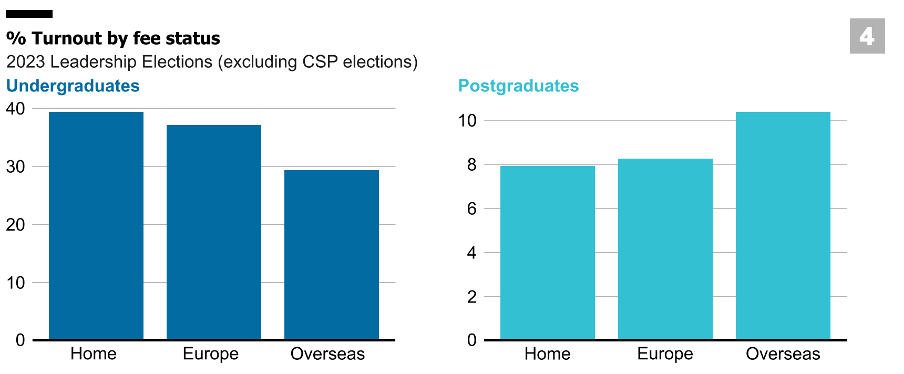
The undergrad-postgrad disparity rears its head in peculiar ways when the electorate is segmented by fee status (see chart 4). Among undergraduates, home students are more likely to participate in ICU elections than European or overseas students. Among postgraduates, the reverse is true.
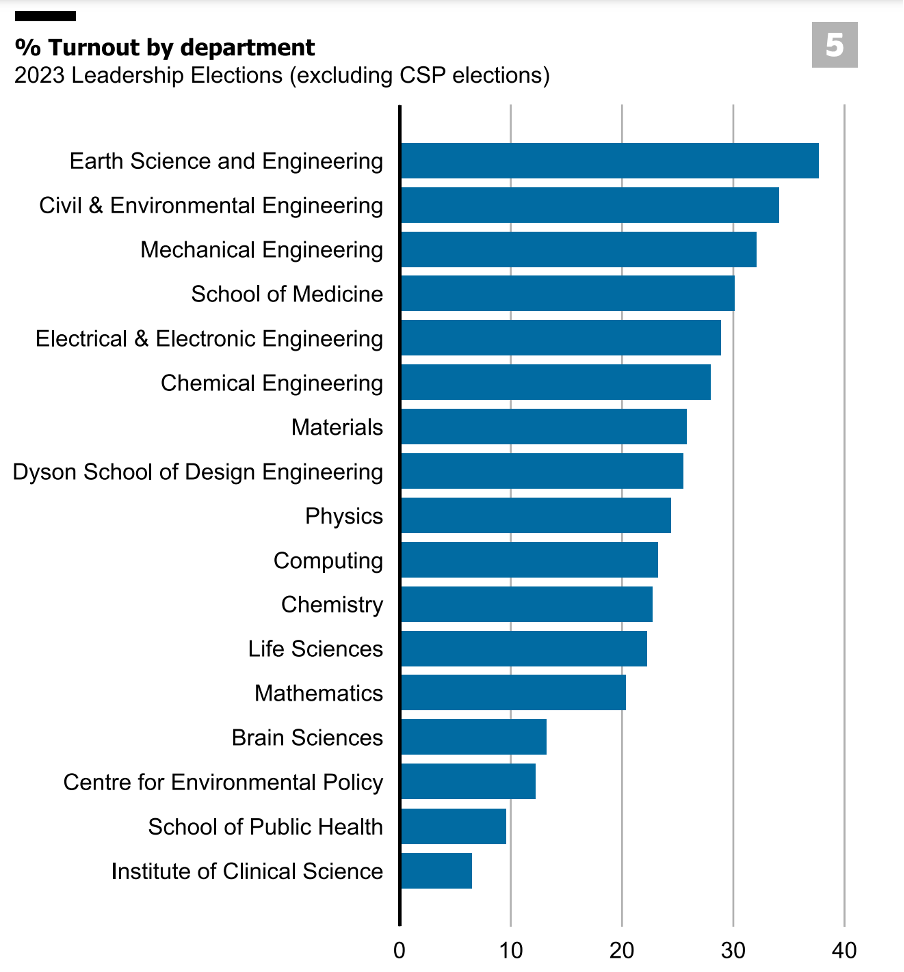
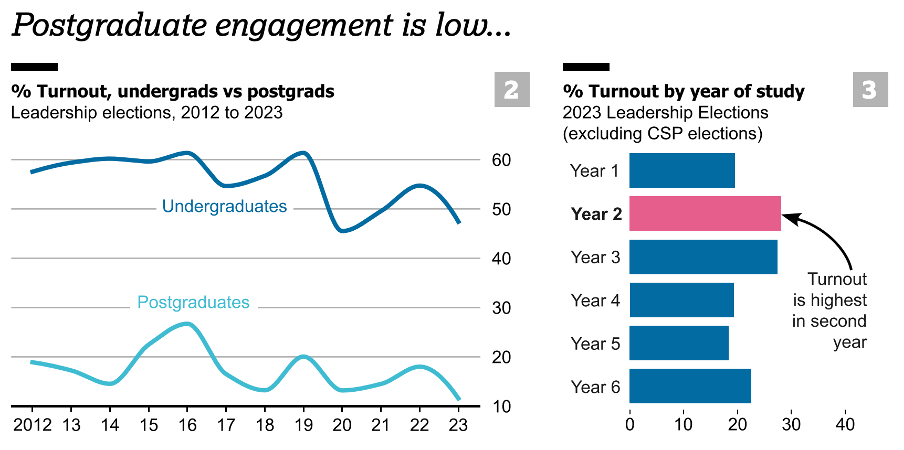
Turnout across the student body seems to peak in the second year of study (see chart 3). A sixth-year spike is visible in the data, but this is almost certainly due to Medicine MBBS students, who turn out in high numbers more broadly (see chart 5), and are enrolled on Imperial’s only six year course.
Percentage turnout for men and women is roughly the same, though the figure for other genders is much lower. Between 2022 and 2023, the number of students with ‘other’ or ‘unknown’ genders jumped from 83 to 679. However, the number who voted remained at around 20, similar to the previous two years.
By the time this article is published on Friday, the 2024 Leadership Elections will have concluded. On Friday evening, the Union will announce its election winners, and on its website, will display this year’s turnout. Pay attention to that number, because it could tell you something interesting.
