Educational: Performing Absolute Evaluation

Investors are typically faced with the question of how much a stock (equity) is worth. To answer this question, there are two ways to value equities. The first method involves the use of ratios and comparison with other equities – relative valuation and the second method involves the use of Discounted Cash Flow (DCF) valuation analysis to work out the exact fair value of a stock. In brief, absolute valuation anchors the evaluation of the fair value of a stock based on the earnings and financial statements of a corporation and utilises a systematic approach of DCF valuation based on assumptions of the future cash flow of a corporation. Nevertheless, the assumptions made for DCF valuation acts as a limiting factor in establishing truly accurate results – it demands clairvoyance to postulate future earnings.
In this article, we will be exploring the absolute valuation method via the means of DCF valuation to create a financial model to evaluate the fair value of a stock. There are five basic steps in creating a financial model for DCF valuations.
- Estimating long-term unlevered future free cash flow based on historical performances
- Estimating the discount rate – Weighted Average Cost of Capital (WACC)
- Discounting the long-term future free cash flow using the WACC.
- Finding out the market capitalisation of the corporation by subtracting debt (outstanding liabilities) and adding cash (asset) on hand.
- Dividing the market capitalisation by the number of outstanding shares to give the estimated fair value of the stock.

Now let us proceed with the step-by-step methodology.
Step 1. Estimating long-term future unlevered free cash flow based on historical performances In this step, this typically requires an investor to make certain assumptions. For instance, to estimate future cash flow, we could assume that a corporation grows at a compounded annual growth rate (CAGR) or a perpetual growth rate of 3%. However, for a start-up, such an assumption may be inappropriate and the assumptions made by an analyst is highly subjective. Therein lies a caveat of financial modelling, these assumptions undermine the accuracy of the financial models. Suppose, however the estimated perpetual growth rate is accurate. Firstly, the cash flows we are using are unlevered Free Cash Flows (FCFF). FCFF refers to the amount of cash a company has to reinvest in other activities or the cash flow left-over after funding growth activities. Note: There are other CF analysis methods such as using levered FCF, but the FCFF method is more frequently used by analyst.
Using the balance sheet to calculate the FCFF:
Unlevered FCF = EBIT (Earnings before Interest & Taxes)*(1-Tax Rate) + Depreciation & Amortisation expense – Capital Expenditure – Increase in Non-Cash Working Capital (NWC)
Where NWC = Accounts Receivable + Inventory – Accounts Payable = Current Assets (less cash) – Current Liabilities (less debt)
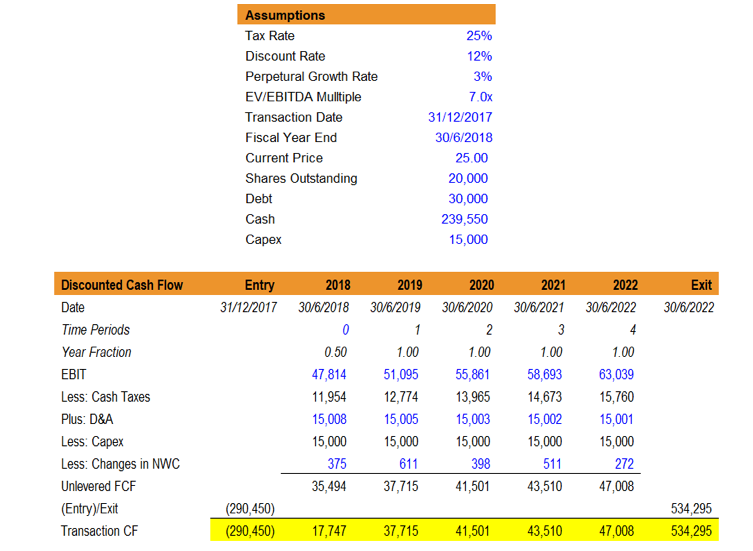
The FCFF projections are based on certain assumptions and FCFF projections in itself is a large topic. FCFF projection, in brief, includes identifying how the drivers of a business and thereby forecasting (typically 5 years into the future) the revenue, expenses, capital assets, capital structure and terminal value of the company. Revenue projections are typically based on either growth-based or driver based, typically growth-based models such as the perpetual growth rate of 3% is used for simplification. Terminal value projection is typically based on either perpetual growth rate approach (treating it as a perpetuity) or the exit multiple approach (using EV/EBIDTA). For the sake of simplification, we will assume that FCFF projections have been worked out as shown below, given the following assumptions.
We will now focus on the transactional CF line which highlights the FCFF for both the entry and exit (terminal value) and the other years of projections.
Note: In reality, FCFF projection is a complicated topic that requires another comprehensive article to explain how to come up with FCFF projections for companies. We will cover FCFF projections in future articles on DCF valuation. Moreover, you are able to attain FCFF projections via the Bloomberg Terminal function – EE (Earnings Estimate) & FA CF (Cash Flow Analysis).
The Bloomberg Terminal is a paid subscription (available at ICL Central Library):
Step 2. Estimating the discount rate – Weighted Average Cost of Capital (WACC)
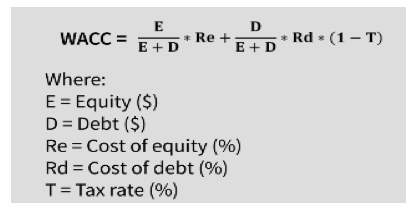
The WACC is given by the formula below – i.e. it is a weighted average between the cost of equity and tax-adjusted cost of debt.
The cost of debt (Rd) can be easily found by finding the yield of the corporate bond offered by the corporation in question. E.g. If the yield of the corporate bond = 5.3% and the tax rate is 10%, the tax-adjusted cost of debt = 4.77%.
The cost of equity (Re) can be found by using the Capital Asset Pricing Model (CAPM) – Formula shown below – where the cost of equity (Re) is equal to the required return for a security (kj). d in this article.

However, all the parameters for CAPM can be found via Yahoo! Finance or through the Bloomberg Terminal – Command Line: WACC.
The cost of equity (Re) can be found by using the Capital Asset Pricing Model (CAPM) – Formula shown below – where the cost of equity (Re) is equal to the required return for a security (kj). To minimise the confusion, the CAPM will not be covered in this article. However, all the parameters for CAPM can be found via Yahoo! Finance or through the Bloomberg Terminal – Command Line: WACC.
Step 3. Discounting the long-term future free cash flow using the WACC.
To understand the concept of discounting a cash flow, remember this phrase “A dollar today is worth more than a dollar tomorrow”. Let us illustrate this with an example. Tim is an investor who puts $1 in his bank account with an annual interest rate of 5%, this implies that at the end of the 1st year, Tim has $1.05 and at the end of the 2nd year, Tim has $1.05 * 1.05 = $1.1025. At the end of 2 years, the future value of his initial investment = $1.1025, but his initial investment, termed as the present value (PV) still remains at $1, where PV = $1.1025/1.052 = $1.
Similar to this idea, you cannot simply compare cash flows at a different points of a timeline. $100 at the 0th year is worth more than $100 in the 2nd year as you would be forgoing interest earned in 2 years. Hence, to compare cash flows at different point in time, you would have to discount the cash flow by the interest rate (the opportunity cost).
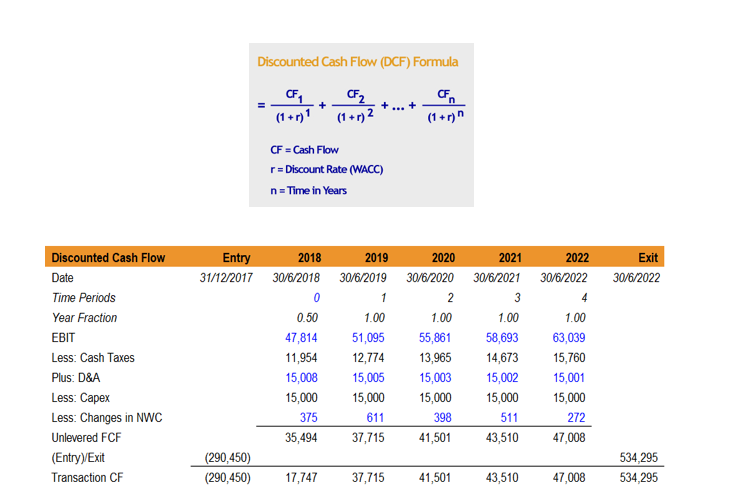
Hence, an extension of this to the DCF formula would be as follows, where CF refers to the free cash flow of the corporation in the future and r refers to the discount rate given by the WACC.:
Using the FCFF projections listed under the Transaction CF:
We can use excel to calculate the discounted cash flow, using the formula XPNV, which gives the discounted cash flow figure i.e. Net Present Value (NPV) of the overall FCFF projections:
The NPV of this cash flow figure would yield the Enterprise Value (EV) of the company.
Step 4. Finding out the market capitalisation of the corporation by subtracting debt and adding cash on hand.
Market Capitalisation = Enterprise Value + Cash & Cash Equivalents – Total Debt
Given that the DCF analysis yields the Enterprise Value of the company – measure of a company’s total value. To calculate the intrinsic value (based on the company’s FCF), you would have to calculate the Market Capitalisation, from the Enterprise Value results from your DCF valuation of the projected FCF of the company.
After adding the Enterprise Value with the Cash & Cash Equivalents and subtracting total debt, the final value would yield the Equity Value/Market Capitalisation of the company.
Step 5. Dividing the market capitalisation by the number of outstanding shares to give the estimated fair value of the stock.
The intrinsic market capitalisation (the value derived after subtracting debt and cash from EV) divided by the total number of outstanding shares (20,000 in this example) would yield the intrinsic value of per share.
Assuming the current market capitalisation of the share (valued by the market) is $500,000 and the current price of the share is $25.00, you can see that the intrinsic value of the equity value/share is greater than the current share price i.e. The share is undervalued and may be a good purchase.

Conclusion:
While DCF analysis may seem like a powerful tool (that can be easily relied upon with the use of the Bloomberg Terminal), there lies multiple disadvantageous of DCF analysis. Firstly, share prices reflect the market’s sentiments towards the corporation. In times of low investor confidence – Global Financial Crisis 08, Dotcom Bubble 2000s – regardless of the intrinsic value of the corporation, investors would severely undervalue corporations in light of the poor market outlook. Moreover, DCF analysis is heavily influenced by the WACC – values which are subjective in nature – for instance, the systematic risk (beta) can easily be valued differently (e.g. using a 5-year vs 10-year outlook or using different statistical approach). Lastly, private equity and start-ups (with their financial statements being unattainable) is a problem which many analysts would face. Predicting the growth drivers and finding accurate estimates for FCFF is a Sisyphean task, given the dynamic nature of start-ups.
Nevertheless, DCF analysis allows an analyst to come up with a good yardstick and estimate of what a corporation is valued at. It is the tool of choice for both investment bankers and equity research analyst alike.


